Identify The Best Entry points Using Japanese Candlesticks
Why Candlesticks?
Today, candlestick charts are widely used amongst investors due to the amount of information that each candle provides.
They are considered to be more visually appealing and much more easier to interpret.
One single candle can provide so much information that sometimes it can tell a whole story, like...
- What has been happening in the market
- The relationship between the open and the close and
- Trading sentiment.
- Even the colours give us important information.
If you look at the following two candles you can probably guess what the colours mean:

Did you know?
Candlestick are are thought to be developed in the 18th Century by Menuhisa Homma, a Japanese rice trader.
The good thing about candlesticks is that apart from their nice attractive colours, each candle gives us loads of valuable information.

How can you use this information?
While some traders simply follow the candles' prices, other traders focus on their shapes and sizes.
By following the different size of the candles and by identifying the trends correctly you can sometimes see reversals or even the start of new trends - way ahead of time!
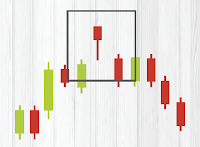
In the below example, say you have a position and are riding on a uptrend. But suddenly comes a big red candle which is much larger than the previous ones. You need to close the trade immediately which will save you unwanted losses from the upcoming downtrend. This is called a reversal.

Big Red Candles: Can indicate selling pressure
Big Green Candles: Can indicate positive sentiment and an interest in the instrument
Popular Shapes and Sizes
Over the years the different types of shapes of the candlesticks have received names. Traders will tend to search for these types of candlestick patterns as they can sometimes point to reversals (Good points for entry and exit).


- Hammer

- Bullish Engulfing
- Has a large candle compared to previous ones
- Must have large green candle (Bullish)
- The engulfing covers the previous candle completely
- A bearish engulfing is similar, but happens after an uptrend

- Hanging Man
- Bullish Morning Doji Star
- Appears only at the end of a downtrend
- Contains one red candle, one doji and a green positive candle
- The Doji's open and close are equal
- Can lead to a strong bullish trend
One Useful Strategy:
After a downtrend, you noticed that a hammer had formed.
As a cautious trader you decided to wait for a break of the down trendline to enter the trade.
Recognising the pattern and waiting for the break turned out to be a very successful trade!

Conclusion
While candlestick patterns are a handy tool to use - you should never only rely on them and should use additional tools to make your trading decisions.
- Has a large candle compared to previous ones
- Must have large green candle (Bullish)
- The engulfing covers the previous candle completely
- A bearish engulfing is similar, but happens after an uptrend

- Hanging Man
- Bullish Morning Doji Star
- Appears only at the end of a downtrend
- Contains one red candle, one doji and a green positive candle
- The Doji's open and close are equal
- Can lead to a strong bullish trend
One Useful Strategy:
After a downtrend, you noticed that a hammer had formed.
As a cautious trader you decided to wait for a break of the down trendline to enter the trade.
Recognising the pattern and waiting for the break turned out to be a very successful trade!
Conclusion
While candlestick patterns are a handy tool to use - you should never only rely on them and should use additional tools to make your trading decisions.

- Bullish Morning Doji Star
- Appears only at the end of a downtrend
- Contains one red candle, one doji and a green positive candle
- The Doji's open and close are equal
- Can lead to a strong bullish trend
- Appears only at the end of a downtrend
- Contains one red candle, one doji and a green positive candle
- The Doji's open and close are equal
- Can lead to a strong bullish trend
One Useful Strategy:
After a downtrend, you noticed that a hammer had formed.
As a cautious trader you decided to wait for a break of the down trendline to enter the trade.
Recognising the pattern and waiting for the break turned out to be a very successful trade!
Conclusion
While candlestick patterns are a handy tool to use - you should never only rely on them and should use additional tools to make your trading decisions.
No comments:
Post a Comment