Saturday, August 13, 2016

Lesson 5: FOREX - Trends and Trendlines

Riding the Trend for better profit potential

In this tutorial we are going to learn about trends, trendlines and Support and Resistance Levels.

What is a trend?

In a nutshell, a trend is the general direction in which the instrument or market is headed.

Identifying the trend is one of the most fundamental things you need to know when using technical analysis. It is so important and so basic, that the concept of "trading the trend" has been around for over 100 years - Yep, that long!

As a matter of fact, Charles Dow, co-fouder of the Dow jones & Company and inventor of the Dow Jones Industrial Average, developed an entire teory based on the trend. His theory, known as the Dow Theory, has become so popular that now it is being used by traders all over the world.

Can you guess what is the trend in the following chart?

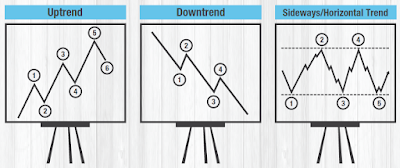
In technical analysis, a trend is identified by a series of highs and lows. For example in the above figure you can see an uptrend, which contains a series of higher-highs and higher-lows.
Tip: remember that using trendlines to identify oppurtunities doesn't mean that you will be successful all the time.

Types of Trends:


Trendlines

Trendlines are really simple, yet very useful.
A trendline is a straight line connecting multiple points on a chart that represent the outskirts of a trend. Even though it might seem a bit ridiculous to plot a trendline as you can easily identify the trend without the trendlines, they are really important as they can show you the following:
  • Potential reversal points
  • Support and resistance areas
  • When a trend changes

How to draw a trendline?

Plotting a trendline in a chart is easy, you simply need to identify the trend and connect the highs or the lows.

How can trendlines help us?

Let's look at the following trend, a sideways trend.
As we mentioned before, the upper and lower trendlines play various roles.
Each time the price went up to the red line a reversal occurred and the price dropped. 
Each time the the price went down to the green line another reversal occurred and the price started to increase.


The red line acted as a reversal line, while the green one acted as a support line.
Knowing previous price patterns and reversal points is one of the key factors when using technical analysis. Especially as previous price patterns can help predict future market trends.

Our Strategy

In the following example we will use a strategy based on trendline analysis.
We can observe that the USD/CHF is ona downtrend and the upper trendline is constantly acting as a support.

Predicting that the price could drop similar to previous times, let's open a short position at 0.8500. We will place our stop loss above the trendline.
Our assumption is that if the price breaks above the trendline a new uptrend can start and cause an unwanted loss. We don't want to get stuck in a short position in a new possible bullish trend, and therefore used a stop-loss.
Fortunately, the trade turned out to be very successful! Over 1000 Pips on the USD/CHF
After hitting the upper trendline the price dropped as planned allowing us to close it at 0.7500.

Conclusion:

While relying on trend and trendlines can be useful - we should never base our trading decisions only on them and we should use additional tools, especially as past performance is not always a reliable indication of future performance.

Lesson 4: FOREX - Japanese Candlesticks

Identify The Best Entry points Using Japanese Candlesticks


Why Candlesticks?

Today, candlestick charts are widely used amongst investors due to the amount of information that each candle provides.
They are considered to be more visually appealing and much more easier to interpret.

One single candle can provide so much information that sometimes it can tell a whole story, like...
  • What has been happening in the market
  • The relationship between the open and the close and
  • Trading sentiment.
  • Even the colours give us important information.
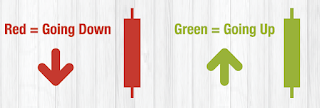
If you look at the following two candles you can probably guess what the colours mean:

Did you know?

Candlestick are are thought to be developed in the 18th Century by Menuhisa Homma, a Japanese rice trader.
The good thing about candlesticks is that apart from their nice attractive colours, each candle gives us loads of valuable information.

How can you use this information?

While some traders simply follow the candles' prices, other traders focus on their shapes and sizes.
By following the different size of the candles and by identifying the trends correctly you can sometimes see reversals or even the start of new trends - way ahead of time!
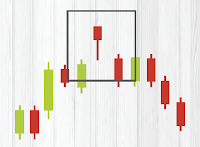
In the below example, say you have a position and are riding on a uptrend. But suddenly comes a big red candle which is much larger than the previous ones. You need to close the trade immediately which will save you unwanted losses from the upcoming downtrend. This is called a reversal.

Big Red Candles: Can indicate selling pressure
Big Green Candles: Can indicate positive sentiment and an interest in the instrument


Popular Shapes and Sizes

Over the years the different types of shapes of the candlesticks have received names. Traders will tend to search for these types of candlestick patterns as they can sometimes point to reversals (Good points for entry and exit).

  • Hammer
    • Great for identifying an upcoming bullish trend
    • has a small body and a long tail
    • The body is located towards the upper part of the candle
    • A green hammer is more reliable than a red one


  • Bullish Engulfing
    • Has a large candle compared to previous ones
    • Must have large green candle (Bullish)
    • The engulfing covers the previous candle completely
    • A bearish engulfing is similar, but happens after an uptrend


  • Hanging Man
    • Indicates that an uptrend is possibly over
    • Appears only after an uptrend
    • The tail should be approximately 2/3rd of the body
    • A red hanging man can indicate to more bearish sentiment


  • Bullish Morning Doji Star 
    • Appears only at the end of a downtrend
    • Contains one red candle, one doji and a green positive candle
    • The Doji's open and close are equal
    • Can lead to a strong bullish trend

One Useful Strategy:

After a downtrend, you noticed that a hammer had formed.
As a cautious trader you decided to wait for a break of the down trendline to enter the trade.
Recognising the pattern and waiting for the break turned out to be a very successful trade!


Conclusion

While candlestick patterns are a handy tool to use - you should never only rely on them and should use additional tools to make your trading decisions.

Tuesday, August 9, 2016

Lesson 3: FOREX - Instrument Type

What are Currency Pairs?


Hi, welcome to our third lesson of Forex Trading. In this lesson we’re going to go over a few basic, yet crucial topics that you should know in order to start trading in the Forex Market.
In the Foreign Exchange Market, currencies are quoted in pairs. This is because in the Forex Market you always want to buy one currency and sell another simultaneously. When you exchange your money at the airport you give one currency to get another. You are actually selling one currency and buying another currency at the same time. Two currencies that are together are called a "currency pair". 


Currency pairs are divided up into 3 groups: The Majors, the Crosses and the Exotics. 
  1. The majors include 7 of the most popular pairs that contain currencies that are traded against the U.S. Dollar and constitute up to 90% of all trades in the Forex Market. This group consists of currencies such as the Euro, the Japanese Yen, the Great British Pound, the Swiss Franc, the Canadian Dollar, the Australian Dollar and the New Zealand Dollar. You can also see what their nicknames are in the rightmost table:
    Nicknames of Major currencies in Forex Market
    Out of all the Major currency pairs, The Euro U.S. Dollar (EUR/USD) is the most traded, accounting for over 30% of all Forex trades followed by the USD/JPY and GBP/USD.
     
  2. The next group is the "Crosses". Crosses are all the currency pairs that don’t contain the U.S. Dollar. They are mainly derived from the Euro, the Pound and the Japanese Yen. Some popular Crosses include the Pound Yen, the Euro Yen and the Euro Pound.
  3.  The next group is the "Exotics". The Exotic Pairs are usually a combination of a less traded currency with a more popular traded one. For example, the South African Rand or the Turkish Lira are classed as exotic currencies and when traded against the U.S. Dollar or Euro, they are classed as Exotic Pairs.


Why the U.S. Dollar is so popular and traded so often?

  1. Reason no 1 is the U.S. has the largest economy in the world and since the Dollar originates from the U.S. it is considered to be a strong currency to trade with.
  2. Secondly, the U.S. has what is called an "enduring" economy giving us belief that the Dollar is a stable currency during times of turmoil.
  3. The third reason that the U.S. Dollar is so popular is because global trade of raw materials is usually done in U.S. Dollars. Think about how many Dollars transfer hands on a daily basis. 

What is currency rate?


As we previously mentioned, two currencies together are classed as a "currency pair" while the number beside it reflects the rate of that pair. A currency pair is made up of a base currency and a quote currency. The "base currency" is always on the left and the “quote” is always on the right. 


The currency rate of a pair signals how much you need to pay in the quote currency in order to buy one unit of the base currency. 

This shows us that you would need to pay 1.4980 dollars to buy one euro. Or in other words every euro is worth 1.4980 dollars.


Why Currency Pairs move and how can you benefit from these?

There are a few reasons as to why a currency pair would move. They tend to change from currency to currency yet the following two reasons usually apply to all currency pairs. 
  1. The first reason is political. Certain political event, such as a new president or government change, can either have a positive or negative impact on a currency. For example, if the UK was to choose a new Prime Minister, some people may see this as a start of a new era where the UK economy could strengthen. This could have a positive effect on the Pound as some people would prefer to hold a currency of a strengthening economy. 
  2. The second reason is economical. If a country has a thriving economy, it usually tends to have a thriving currency as well. A negative impact on a country's economy can sometimes have a negative impact on that country's currency. When there is political or economical news released from a country, such as the United States, it tends to have a profound effect on the currency and in general, the Forex Market. 
Let’s take a look for example at the Unemployment Rate in the United States. This rate is released once a month, on the first Friday of every month and shows how many people are unemployed throughout the U.S. economy. This rate, when released, is also compared to the previous month’s rate and shows us if more or less people have found employment. When you look a little closer at this rate, it shows us whether the U.S. economy is growing or shrinking from day to day. Each time the unemployment report is released – one of two things usually to happen: If the report is positive, more than expected, this can indicate that the U.S. has created more jobs, therefore lessening the number of unemployed people – as a result the U.S. Dollar may rise. This is because investors think that if the U.S. economy is strengthening, so should the country’s currency – this urges traders to invest and buy the U.S Dollar. If the report on the other hand is a negative one, lower than expected, this can indicate that the U.S has a higher number of unemployed people in the economy. This situation tends to weaken the U.S Dollar. Trading during the unemployment rate announcement arguably is a highlight for many traders as it presents them with many opportunities. 


For example, let’s take a look at a hypothetical unemployment report that could have been released. 
Our report, released in August, shows that the numbers are going down compared to the previous month and is better than was expected. This signals to traders that the U.S. economy is strengthening, since the economy is creating more jobs for unemployed people.


Great news, right? Did you know that some traders have even made sums of up to $300on the day that the unemployment report was released! Keep in mind that we focused now on just one news event and also took into consideration investor’s expectations. 


On any given day, there can be several news or other events that could impact the Forex market and have an influence on currency pairs. Some tend to be more important than others yet they all present you with the opportunity to start trading. 


Now that we’ve covered some important points that you need to know when trading, let’s see if you can answer these 4 questions correctly (Please put your answers in the comment section. Right answers will be provided in the next blog):
  1. The most popular traded currency pair is the:
    • EUR/USD
    • GBP/USD
    • USD/JPY
  2. Major currency pairs are those that are:
    • Traded against one another
    • The most difficult to buy and sell
    • The most popular and are traded against the Dollar
  3. Currency rates are usually effected by:
    • The weather and different religious holidays
    • Political and economical news
    • Other currency rates
  4. The Unemployment Rate in the United States is:
    • Released once a month, on the first Friday and shows the number of unemployed people
    • Released twice a month, and shows the number of people that have found employment during that month
    • Released once a month, on the first of the month and shows how many people are employed