Riding the Trend for better profit potential
In this tutorial we are going to learn about trends, trendlines and Support and Resistance Levels.
What is a trend?
In a nutshell, a trend is the general direction in which the instrument or market is headed.
Identifying the trend is one of the most fundamental things you need to know when using technical analysis. It is so important and so basic, that the concept of "trading the trend" has been around for over 100 years - Yep, that long!
As a matter of fact, Charles Dow, co-fouder of the Dow jones & Company and inventor of the Dow Jones Industrial Average, developed an entire teory based on the trend. His theory, known as the Dow Theory, has become so popular that now it is being used by traders all over the world.
Can you guess what is the trend in the following chart?
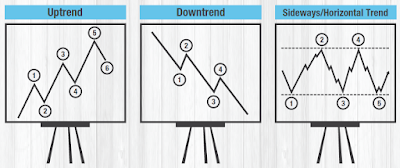
In technical analysis, a trend is identified by a series of highs and lows. For example in the above figure you can see an uptrend, which contains a series of higher-highs and higher-lows.
Tip: remember that using trendlines to identify oppurtunities doesn't mean that you will be successful all the time.
Types of Trends:
Trendlines
Trendlines are really simple, yet very useful.
A trendline is a straight line connecting multiple points on a chart that represent the outskirts of a trend. Even though it might seem a bit ridiculous to plot a trendline as you can easily identify the trend without the trendlines, they are really important as they can show you the following:
- Potential reversal points
- Support and resistance areas
- When a trend changes
How to draw a trendline?
Plotting a trendline in a chart is easy, you simply need to identify the trend and connect the highs or the lows.
How can trendlines help us?
Let's look at the following trend, a sideways trend.
As we mentioned before, the upper and lower trendlines play various roles.
Each time the price went up to the red line a reversal occurred and the price dropped.
Each time the the price went down to the green line another reversal occurred and the price started to increase.
The red line acted as a reversal line, while the green one acted as a support line.
Knowing previous price patterns and reversal points is one of the key factors when using technical analysis. Especially as previous price patterns can help predict future market trends.
Our Strategy
In the following example we will use a strategy based on trendline analysis.
We can observe that the USD/CHF is ona downtrend and the upper trendline is constantly acting as a support.
Predicting that the price could drop similar to previous times, let's open a short position at 0.8500. We will place our stop loss above the trendline.
Our assumption is that if the price breaks above the trendline a new uptrend can start and cause an unwanted loss. We don't want to get stuck in a short position in a new possible bullish trend, and therefore used a stop-loss.
Fortunately, the trade turned out to be very successful! Over 1000 Pips on the USD/CHF
After hitting the upper trendline the price dropped as planned allowing us to close it at 0.7500.
Conclusion:
While relying on trend and trendlines can be useful - we should never base our trading decisions only on them and we should use additional tools, especially as past performance is not always a reliable indication of future performance.


